One Hundred-thousand Travellers pt. 2
Below are a few additional experiments using my Classic Traveller character generation script.
More Optimized Service Selection
In the discussion following the previous post, it was pointed out that survival and promotion rates would look different if characters were attempting to enlist in services they were well suited for.
I updated the character generator to weight the random enlistment selection according to how likely a character was to succeed. Specifically:
- Base chance of 1 for all services.
- If a character qualifies for the survival DM, add four additional chances.
- Extra chances are added equal to the enlistment DM (one extra if they qualify for the +1 DM, two for the +2, three for both)
- Likewise, qualifying for the commission and promotion DMs both add one extra chance.
Thus, a character who qualifies for all possible DMs for (e.g.) the Navy will draw from a virtual "deck" with nine total Navy cards to choose their "desired" service.
One issue is that this penalizes the Other and Scout services, since they can never get the two extra chances from commission and promotion. I think this is fine, though -- it seems reasonable that this would steer characters away from these services, and likewise that these services would rely more on the draft.
Results
This change only shifted the live/dead split from 48% live /52% dead to 52% live / 48% dead.
Many more people ended up in the Army (20k last time), and fewer ended up in Other (previously 20k). Merchants went up slightly, Scouts declined slightly, and Marines and Navy are almost exactly the same.
Survival rate jumped the most for Other (52% -> 58%) and otherwise only increased by 2-3%.
| Service | Count | Survival | STR | DEX | END | INT | EDU | SOC | AGE | Skills |
|---|---|---|---|---|---|---|---|---|---|---|
| Army | 30030 | 0.61 | 6.85 | 7.19 | 7.08 | 6.40 | 7.40 | 6.93 | 24.46 | 4.18 |
| Marines | 11496 | 0.57 | 7.35 | 6.92 | 7.24 | 6.82 | 6.86 | 7.09 | 26.85 | 3.83 |
| Merchants | 21300 | 0.45 | 5.91 | 5.57 | 4.97 | 7.45 | 6.75 | 6.94 | 41.60 | 8.74 |
| Navy | 13485 | 0.78 | 6.44 | 6.78 | 6.51 | 7.59 | 7.69 | 7.28 | 29.67 | 4.75 |
| Other | 10208 | 0.58 | 6.08 | 6.48 | 6.15 | 7.47 | 6.75 | 6.80 | 32.41 | 4.45 |
| Scouts | 13481 | 0.06 | 7.06 | 6.77 | 7.07 | 6.86 | 6.83 | 6.98 | 28.27 | 3.21 |
I'm guessing that the lack of impact comes down to a few factors:
- The career selection is imperfect -- simulated characters are more likely to pick good careers, but it is still very random.
- Career selection takes advancement into account, but longevity only hinges on the Survival DM.
- The impact of career selection is limited by the likelihood of qualifying for a DM in the first place.
What about ranks?
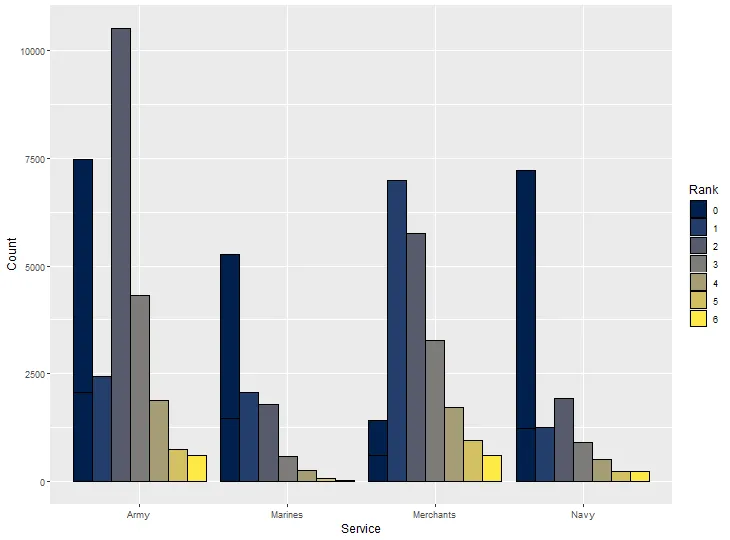
The overall patterns are similar. It looks like the ratio of unenlisted to enlisted Navy spacers is substantially better, however. Same with marines. If you squint, slight improvements can be seen for most other services.
Alternate Stopping Strategies
Thank you to MTB for suggesting this one.
All of the previous batches used a very crude approach for simulating player decision-making (or rather, lack thereof) regarding reenlistment: attempt to re-enlist until either death or a failed re-enlistment roll.
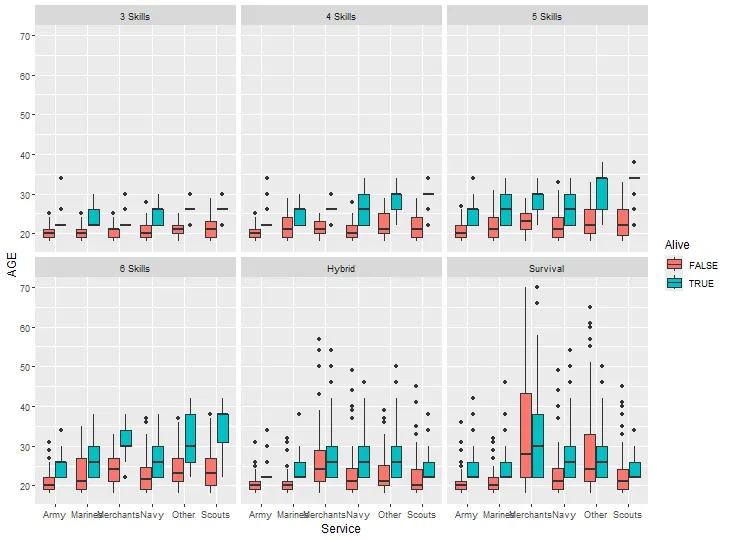
For these, I tested sets of 1,000 characters with different algorithms for determining when to stop.1 Keep in mind that any stopping strategy can be overridden by a result of 12 on the reenlistment roll, which requires a character to do another term.
After n skill increases
From a player's perspective, the goal of character creation is to get a character with useful skills. Losing a shitty character isn't a big deal, but the more lucky promotions you get, the stronger the desire to "quite while you're ahead". This, one viable strategy is simply to quit after enough skills are earned.
Set to to survival odds
For this strategy, I added a die roll to simulate desire to reenlist, with a target equal to the survival roll. The intuition here is that the more dangerous the career, the more likely one is to drop out and not push their luck. Making it random simulates the fact that different players will have different preferences, but ultimately how rational it is to push your luck hinges on your odds of dying.
Hybrid
This approach pairs both of the above. Decision to drop out is randomized, but the target increases with number of skill rolls (+1 per three rolls) and total character stats (+1 if sum of stats is greater than the 80th percentile (47), -1 if less than the 20th percentile (37))
Results
| Service | Strategy | Count | Survival | Mean_AGE | Mean_skills |
|---|---|---|---|---|---|
| Army | 3 Skills | 631 | 0.74 | 21.79 | 3.09 |
| Army | 4 Skills | 631 | 0.73 | 22.03 | 3.19 |
| Army | 5 Skills | 631 | 0.68 | 23.08 | 3.64 |
| Army | 6 Skills | 631 | 0.67 | 23.40 | 3.77 |
| Army | Hybrid | 631 | 0.73 | 22.24 | 3.25 |
| Army | None | 631 | 0.63 | 24.51 | 4.22 |
| Army | Survival | 631 | 0.71 | 22.69 | 3.45 |
| Marines | 3 Skills | 215 | 0.79 | 23.23 | 2.75 |
| Marines | 4 Skills | 215 | 0.74 | 24.16 | 3.03 |
| Marines | 5 Skills | 215 | 0.72 | 24.99 | 3.34 |
| Marines | 6 Skills | 215 | 0.68 | 25.60 | 3.49 |
| Marines | Hybrid | 215 | 0.78 | 23.26 | 2.70 |
| Marines | None | 215 | 0.62 | 26.91 | 3.86 |
| Marines | Survival | 215 | 0.76 | 24.06 | 2.96 |
| Merchants | 3 Skills | 418 | 0.92 | 22.72 | 3.25 |
| Merchants | 4 Skills | 418 | 0.88 | 24.78 | 3.84 |
| Merchants | 5 Skills | 418 | 0.83 | 27.33 | 4.58 |
| Merchants | 6 Skills | 418 | 0.80 | 29.50 | 5.25 |
| Merchants | Hybrid | 418 | 0.81 | 27.72 | 4.67 |
| Merchants | None | 418 | 0.41 | 41.34 | 8.64 |
| Merchants | Survival | 418 | 0.70 | 32.08 | 5.97 |
| Navy | 3 Skills | 248 | 0.86 | 23.76 | 2.72 |
| Navy | 4 Skills | 248 | 0.86 | 25.17 | 3.16 |
| Navy | 5 Skills | 248 | 0.83 | 26.12 | 3.48 |
| Navy | 6 Skills | 248 | 0.81 | 26.80 | 3.73 |
| Navy | Hybrid | 248 | 0.83 | 25.53 | 3.29 |
| Navy | None | 248 | 0.75 | 28.87 | 4.43 |
| Navy | Survival | 248 | 0.83 | 26.26 | 3.58 |
| Other | 3 Skills | 196 | 0.79 | 24.45 | 2.53 |
| Other | 4 Skills | 196 | 0.73 | 26.40 | 2.99 |
| Other | 5 Skills | 196 | 0.70 | 27.82 | 3.34 |
| Other | 6 Skills | 196 | 0.67 | 28.96 | 3.60 |
| Other | Hybrid | 196 | 0.73 | 26.36 | 2.97 |
| Other | None | 196 | 0.52 | 32.06 | 4.32 |
| Other | Survival | 196 | 0.66 | 27.79 | 3.30 |
| Scouts | 3 Skills | 292 | 0.45 | 23.22 | 2.09 |
| Scouts | 4 Skills | 292 | 0.37 | 24.65 | 2.42 |
| Scouts | 5 Skills | 292 | 0.26 | 25.66 | 2.63 |
| Scouts | 6 Skills | 292 | 0.21 | 26.37 | 2.79 |
| Scouts | Hybrid | 292 | 0.48 | 22.96 | 2.04 |
| Scouts | None | 292 | 0.07 | 27.59 | 3.03 |
| Scouts | Survival | 292 | 0.45 | 23.21 | 2.10 |
There's clearly a tradeoff between stopping strategy and survival rate, so I tried plotting mean skills against survival rate.
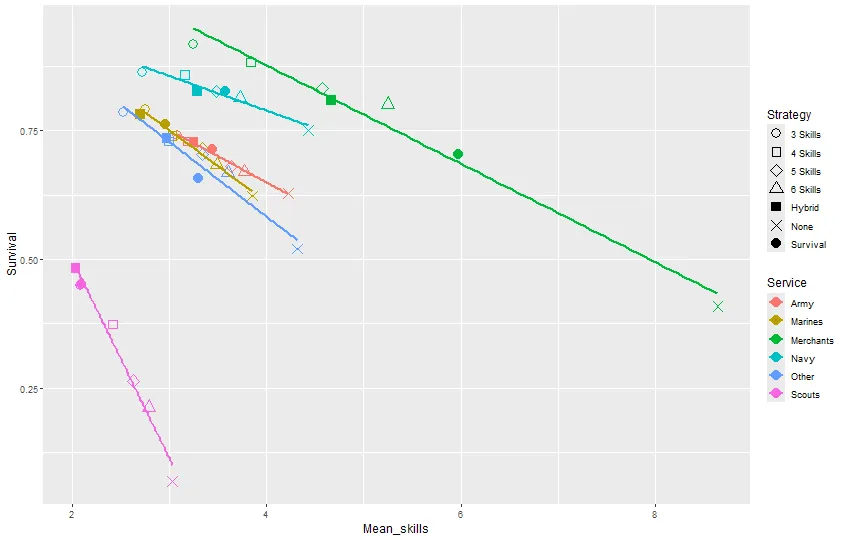
I don't actually know (or care to find out) if it is statistically valid to plot lines of best fit in this way, but I think it makes sense that the interplay between likelihood of skill increases vs. likelihood of death results in a quasi linear relationship between survival rate and skills.
I think this plot is particularly useful for getting a sense of how many skills you can expect to get at a given level of risk tolerance.
Testing My Homebrew Services
When I wrote my Three Traveller Services, my intent was to create relatively less-lethal services with their own quirks. The Castalians are meritocratic and have high promotion throws and moderate re-enlistment difficulty -- making it all the way to Magister Ludi should be rare, but it's not a very dangerous profession (unless you take spontaneous dips into pristine alpine lakes).
The Church is a bit more dangerous, since it does missionary work on remote, backwater planets. The enlistment roll is high -- it's hard to get a foothold in the church's ranks -- but once you're in advancement is easier.
MTB ended up testing out a Clergyman and reported that advancement felt too easy, and Ms. Quixotic suggested testing it on thousands of computer-generated characters, which precipitated this whole effort.
So, I modified the code to include my homebrew classes, and spun up 10,000 more characters.
| Service | Count | Survival | STR | DEX | END | INT | EDU | SOC | AGE | Skills |
|---|---|---|---|---|---|---|---|---|---|---|
| Army | 23958 | 0.62 | 6.89 | 7.19 | 7.08 | 6.49 | 7.39 | 6.72 | 24.48 | 4.12 |
| Brand_Ambassador | 2773 | 0.71 | 6.48 | 6.65 | 6.97 | 7.26 | 6.70 | 9.25 | 28.79 | 5.20 |
| Castalian | 1793 | 0.73 | 5.58 | 5.90 | 5.42 | 7.99 | 9.56 | 7.00 | 36.29 | 7.97 |
| Church | 10222 | 0.13 | 5.33 | 5.50 | 4.87 | 6.95 | 7.85 | 8.95 | 39.69 | 7.92 |
| Marines | 10317 | 0.58 | 7.28 | 6.91 | 7.22 | 6.87 | 6.91 | 6.89 | 26.90 | 3.78 |
| Merchants | 17972 | 0.45 | 5.95 | 5.61 | 5.02 | 7.41 | 6.77 | 6.75 | 41.40 | 8.65 |
| Navy | 11876 | 0.78 | 6.48 | 6.80 | 6.59 | 7.54 | 7.55 | 7.08 | 29.74 | 4.73 |
| Other | 9364 | 0.55 | 6.13 | 6.47 | 6.22 | 7.37 | 6.78 | 6.59 | 32.40 | 4.43 |
| Scouts | 11725 | 0.06 | 7.06 | 6.82 | 7.05 | 6.90 | 6.88 | 6.79 | 28.04 | 3.16 |
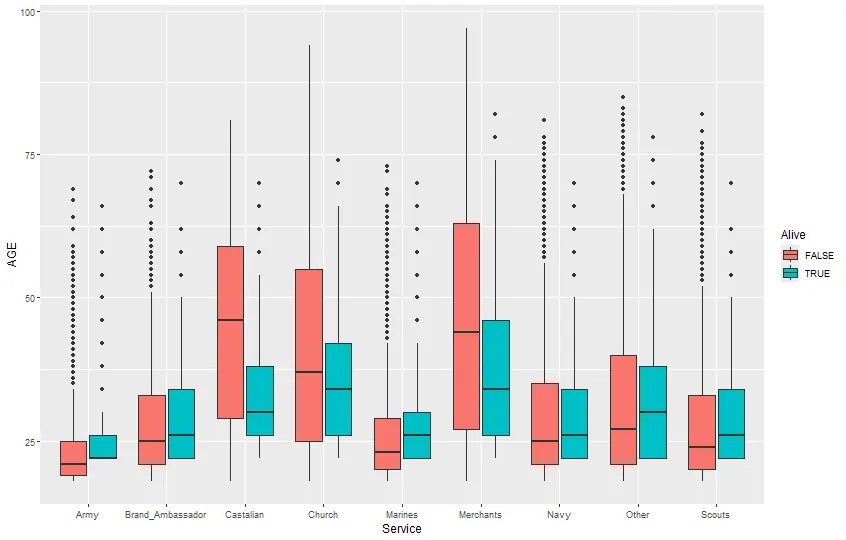
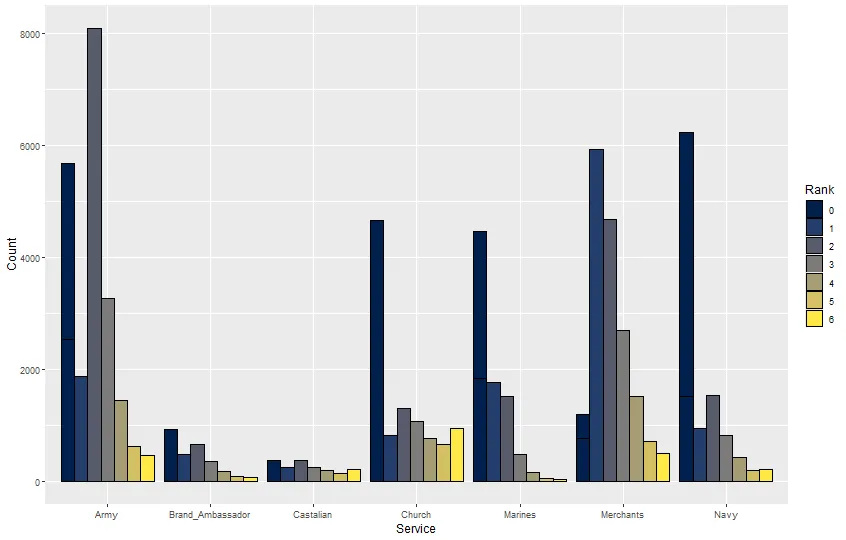
I think it's good that Castalians have a low rate of enlistment -- these should be fairly uncommon classes, overall. But I'm glad that there are a couple Magisters Ludi among them.
In general, I think it's appropriate for these professions to be fairly safe -- thematically, it's fun to have an aged scholar or priest on the crew. Rather than crank up lethality further, I'm going to nudge down the muster out rewards -- you can accumulate lots of terms easily, but the payoff will be less than a more dangerous career.
Each batch was simulated with the same random seeds. Thus, everything happening before the re-enlistment decision routine (enlistment, draft, attribute rolls) is constant for all simulations.↩