One Million Planets
During some downtime at work I wrote up a little R script to generate Classic Traveller1 planet UPPs and then made a dataset with one million worlds.2
The Stats
In this set of 1 million planets, there are 876,000 unique UPPs. The number of possible codes is vast and this dataset barely covers it. The most commonly-repeated UPP only appears 28 times.
In general, the most common UPPs are variations on asteroids with 0-1 size, 0 atmosphere, and 0 water. This is a result of the way the rules truncate the possibility space (there are no atmosphere and water values below zero, so die rolls that would have mapped to -30% water just default to 0).
Population
Part of the 'sauce' in CT planet generation is that population is a flat 2d6 roll that doesn't take the planet's physical environment into account. Thus, you can get asteroids with 10 billion people, or lonely outposts of 100 colonists on a vast, verdant earth-like world.
I decided to calculate an exact population, per Book 3:3
For example, a population digit of 6 indicates a population of 1,000,000. It can be construed to actually cover a range from slightly more than the next lowest level (100,000) to slightly less than the next highest level (10,000,000).
I added a random value from -1 to 1 to each population digit and then calculated 10^pop. This keeps the logarithmic scaling -- values on the lower end of each range are more likely vs. what you'd get picking a uniform random value from the range 100,000 - 10,000,000.
The median population is 100,000 -- half of all planets in the Classic Traveller universe have fewer denizens than Albany, New York (!!). The mean population, however, is over 700 million thanks to the logarithmic distribution.
The 5,700 (0.57%) most populous planets account for 50% of the galaxy's population. 90% of all people live on 33,000 worlds (3.3%). The uniformity of Traveller's hexmap belies the fact that most actual history is probably being made on a tiny handful of populated worlds.
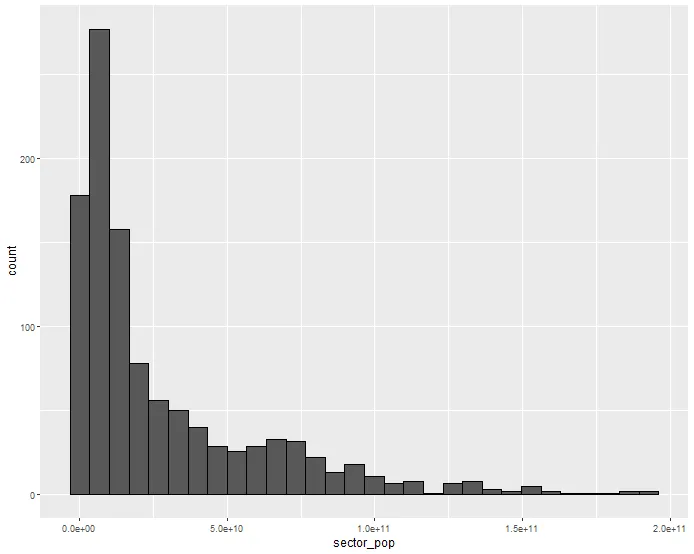
I was also curious about how much variation there was in the total population of a typical sub-sector, so I sampled 1000 subsectors by generating a random number of planets/sector with 80 coin-flips, then sampling that many planets from the million-planet dataset and crunching out the total population.
I got a pretty wide range, with a mean of 29 billion but a median of 13 billion. A non-negligible number had a population under one billion. The largest had over 100 billion.
What about population density? I calculated surface area based on the Size digit, and multiplied it by hydrographic percentage to get land area. The results really hammer home just how lopsided the population structure of CT's universe is: the median population density is .0057 people/sq. mi of land, or one person per 173 sq. mi. This is less than one tenth as dense as Greenland. The 95th percentile of population density is 166 people/sq. mi, on par with Mexico, Ukraine, or Panama.
The densest worlds have upwards of 3 million people per square mile, but these are mostly asteroids and water worlds, so using land surface area as a metric breaks down -- one would assume they'd be using the asteroid's interior and underwater habitats, respectively.
Tech
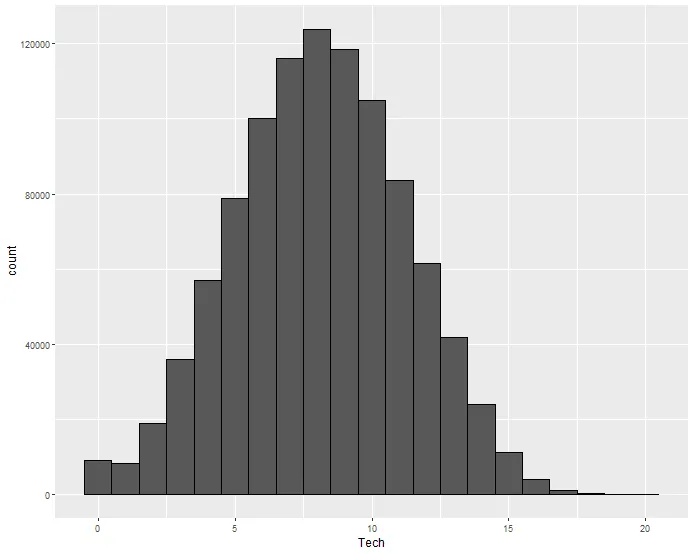
The average (mean, median, and mode) tech level is 8. This is notably one level shy of that needed to produce starships, so the average CT planet relies on the shipyards other systems for interstellar trade and travel.
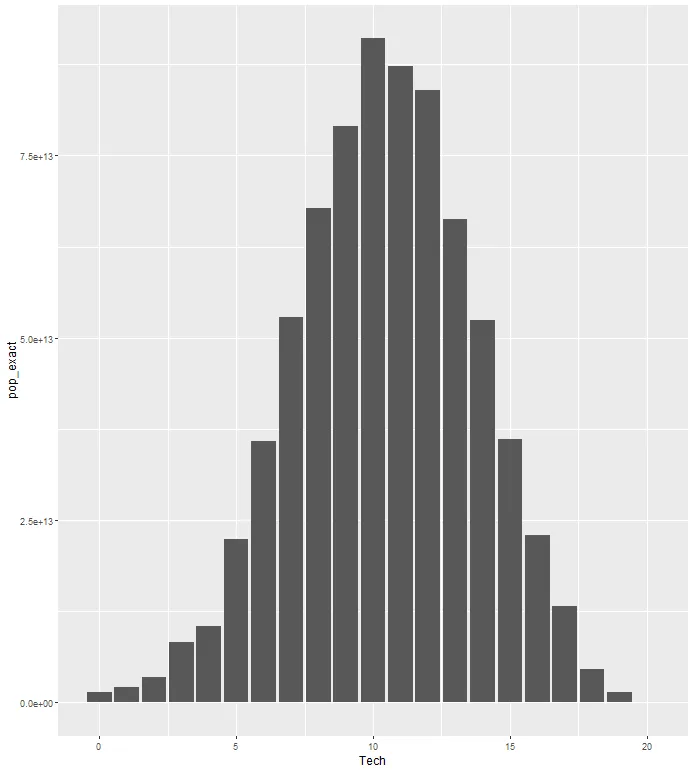
When we consider population, however, the modal tech level increases to 10. The worlds where most people live tend to be slightly more advanced, and able to produce interstellar jump drives.
Government
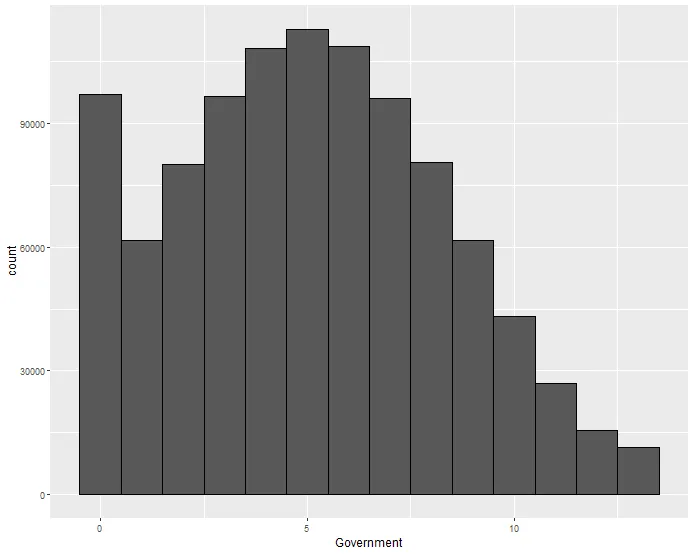
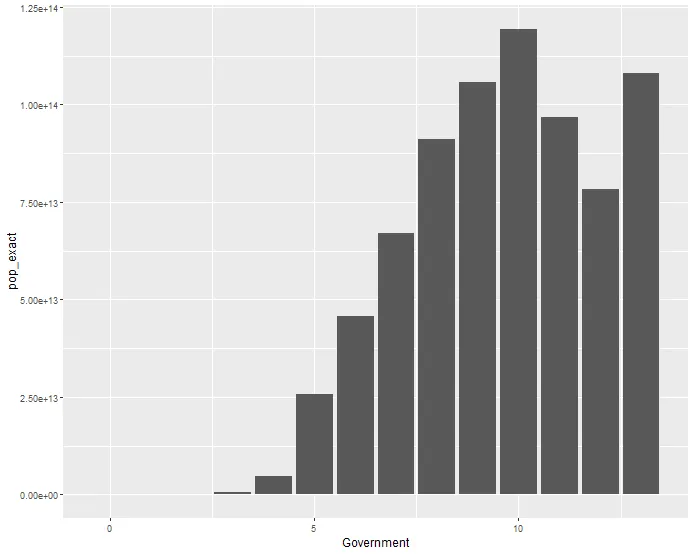
The base distribution of governments isn't terribly interesting -- Feudal Technocracy (5) is fittingly the top variety. Kinship/anarchy (0) punches above it's weight due to the way negative values truncate at zero.
However, as a result of the math going into the roll, relatively few people actually live under a Feudal Technocracy. In the grim darkness of the far future, most people live on planets ruled by Charismatic Dictators. After that are Religious Dictatorships and Impersonal Bureaucracies.
Specific types of world
Low-tech worlds
13% of the planets (130,000) have a tech level of 4 (industrial era) or less. These have a median population of 340,000, but a mean of 199 million, so they are more clustered around middle population values. (Since the tech adjustments table bumps up the dm for low and high population worlds).
Earth-likes
Earth's UPP is something like X-87697?-6. To get a sense of how many planets are Earth-like I filtered the list to those with size in the 5-10 range, atmosphere of 5 (thin), 6 (standard) or 8 (dense), and hydrography of 40-80%. Only 13% of the dataset met these criteria.
Alternately, we can use a really loose definition of "Earthlike". When I allow tainted atmospheres, size range 3-10, and any hydrography, the subset grows to 51% of the dataset. Thus, about half of all Traveller planets are ones where you can walk around more or less normally, and where settlements probably resemble Terran towns and cities rather than hermetically sealed space stations.
Desert planets
I defined these as worlds with a breathable atmosphere but little water. I expanded the size range to 3-10, atmosphere of 4-9, and hydrography of 20% or less. Only 7.2% of worlds met these criteria.
Ocean worlds
As above, but hydrography of 90-100%. These worlds account for 10.3% of the set.
Trade Tags
- Agricultural: 13.1% of all worlds qualify.
- Non-agricultural: 10% are dependent on agricultural imports.
- Industrial: only 4.2% are considered "Industrial"
- Industrial worlds have a modal Tech Index of 9, but the dataset has 1000 planets marked as "Industrial" with a Tech Index of 0-3 (pre steam engine). One could imagine these as nightmarish slave empires where laborers toil in primitive workhouses powered by the Wheel of Pain from Conan The Barbarian (1982), or as Ghibli-esque utopias of wind & water power.
- Non-industrial: 72% are "non-industrial"! (Population 6 or less)
- Rich: 4.5%
- Poor: 15.5%
Concluding notes
As noted, none of this really has any bearing on how Traveller is played. It's also not that illuminating to analyze since most of the values derive from the pyramidal 2d6 distribution.
The main thing I found interesting was just how incredibly under-populated the average planet is. The game-representations Traveller relies on (UPP codes, the hexmap, trade and patron tables) flatten out the mind-boggling differences between vast worlds with millions/billions of people and the barely-populated hinterlands a few parsecs away. The actual "world" of Classic Traveller is a network of spaceports that anchor brief dives into imagined planets of unfathomable fractal complexity.
If anyone reading this has suggestions for interesting stats or visuals, let me known on Discord or Bluesky -- I'd be happy to do some additional analysis.
Code
library(tidyverse)

r2d6 <- function(dm = 0, max = NA, min = NA){
  d1 = sample(1:6, 1)
  d2 = sample(1:6, 1)

  res <- d1+d2+dm

  if (!is.na(max)){res <- min(res, max)}
  if (!is.na(min)){res <- max(res, min)}

  return(res)
}


starports <- data.frame(
  "Roll" = 2:12,
  "Starport" = c("A", "A", "A", "B", "B", "C", "C", "D", "E", "E", "X")
)


tech_lut <- data.frame(
  "Value" = 0:14,
  "Size" = c(2, 2, 1, 1, 1, 0, 0, 0, 0, 0, 0, 0, 0, 0, 0),
  "Atm" = c(1, 1, 1, 1, 0, 0, 0, 0, 0, 0, 1, 1, 1, 1, 1),
  "Hyd" = c(0, 0, 0, 0, 0, 0, 0, 0, 0, 1, 2, 0, 0, 0, 0),
  "Pop" = c(0, 1, 1, 1, 1, 1, 0, 0, 0, 2, 4, 0, 0, 0, 0),
  "Gov" = c(1, 0, 0, 0, 0, 1, 0, 0, 0, 0, 0, 0, 0, -2, 0)
)

starport_lut <- data.frame(
  "Starport" = c("A", "B", "C", "D", "E", "X"),
  "DM" = c(6, 4, 2, 0, 0, -4)
)


generate_planet <- function(seed = NA){
  if(!is.na(seed)){set.seed(seed)}

  # starport
  starp <- starports[starports$Roll == r2d6(), "Starport"]

  # size -- simple 2d6 - 2
  psize <- r2d6(-2)

  # atmosphere -- none if size zero, otherwise dm of size - 7
  if (psize == 0){atmos <- 0} else {atmos <- r2d6(dm = psize - 7, max = 12, min = 0)}

  # hydro: if size is zero or 1, no liquids. Base dm of size - 7. If atmosphere is very thin or exotic, additional -4 dm.
  if (psize <= 1){hydro <- 0} else {
    hydro_dm <- ifelse(atmos %in% c(0, 1, 10, 11, 12), psize - 11, psize - 7)
    hydro <- r2d6(dm = hydro_dm, max = 10, min = 0)
  }

  # population: flat 2d6-2
  popul <- r2d6(-2)

  # government: 2d6 + population - 7
  pgovt <- r2d6(dm = popul - 7, min = 0, max = 13)

  # law: 2d6 + government - 7
  lawlv <- r2d6(dm = pgovt - 7, min = 0, max = 9)

  # tech: lookup table
  t_starport_dm <- starport_lut[starport_lut$Starport == starp, "DM"]
  t_siz_dm <- tech_lut[tech_lut$Value == psize, "Size"]
  t_atm_dm <- tech_lut[tech_lut$Value == atmos, "Atm"]
  t_hyd_dm <- tech_lut[tech_lut$Value == hydro, "Hyd"]
  t_pop_dm <- tech_lut[tech_lut$Value == popul, "Pop"]
  t_gov_dm <- tech_lut[tech_lut$Value == pgovt, "Gov"]

  teclv <- sample(1:6, 1) + t_starport_dm + t_siz_dm + t_atm_dm + t_hyd_dm + t_pop_dm + t_gov_dm

  outdf <- data.frame(
    "Starport" = starp,
    "Size" = psize,
    "Atmosphere" = atmos,
    "Hydrography" = hydro,
    "Population" = popul,
    "Government" = pgovt,
    "Law" = lawlv,
    "Tech" = teclv
  )
  return(outdf)
}

generate_planet()
generate_planet(2)

planets.df <- lapply(1:1000000, generate_planet) |>
  bind_rows()

planets.df <- planets.df |>
  mutate(UPP = paste0(Starport, "-", as.hexmode(Size), as.hexmode(Atmosphere), as.hexmode(Hydrography), as.hexmode(Population), as.hexmode(Government), as.hexmode(Law), "-", Tech)) |>
  mutate(Tech = Tech |> replace_when(
    Tech < 0 ~ 0
  )) |>
  rowwise() |>
  mutate(pop_adj = runif(1, -1, 1) + Population) |>
  mutate(pop_exact = 10^max(pop_adj, 0)) |> ungroup()
Using the 1977 booklets. Thus, I'm used to referring to planet codes as UPPs rather than UWPs.↩
Disclaimer: In my opinion Traveller is much more fun when your prep is analog. It's better to slowly roll up a planet by hand and gradually "discover" it than to squint at an instantly-generated UPP and try to interpret the whole thing at once. Still, it's kind of fun to try to draw inferences about the type of universe the 1977 booklets imply, hence all this.↩
I think this is a bit odd, as it opens the possibility that a planet might have a lower population than a planet with a higher population digit (e.g. a population 5 world could have 30,000 people and a population 4 world could have 60,000). I think the intent was to grant referees maximal freedom to interpret the values, but I think I prefer to eliminate the overlaps and treat the digits as lower bounds for my own game.↩